AI Models Usage Observability
Bringing trustworthy, self‑serve usage monitoring to Atlas AI models by unifying tokens, pixels, free quotas, and API traffic in one place.
Project overview
How might we give Atlas users a clear view of AI Models usage and free quotas at both org and project level, in a way that fits Atlas' billing model and keeps "usage" and "cost" conceptually separate?
Displaying Voyage AI Models natively
After the Voyage acquisition, Atlas introduced AI Models as the hosted way to use Voyage AI's models inside Atlas. My work was to design how Usage Activity and Free Usage for AI Models should live in Atlas, while making sure that:
- •Existing Voyage users don't lose visibility when they move into Atlas.
- •All users can understand usage, free quotas, and cost drivers for AI Models natively within Atlas.
What users need to understand about usage
- •Which models am I actually using, and how much?
- •How much of my free quota remains before I start paying?
- •Which API keys or projects are driving the most consumption?
Answering these questions clearly shaped how usage was structured, segmented, and surfaced across organization and project-level views.
Design principles
Support cross-project insight at the organization level
Enable organization owners to understand usage by project directly from the organization-level view, without requiring navigation into individual projects.
Make usage legible over time
Present usage as clear, predictable time-series data, so users can monitor trends, spikes, and changes without interpreting raw logs.
Treat free usage as first-class
Surface free usage quota and consumption by model explicitly, so users always understand what remains free and what will begin contributing to paid usage.
Make drivers of usage easy to identify
Commitment shortfalls and carry-overs directly affect billed usage. The UI should make that relationship explicit.
The solution
Mapping Voyage to Atlas: Redesigning the information architecture
Voyage's original structure separated Cost, Activity, and Free Token views across org and project levels. In Atlas, I needed to adapt this structure to fit Atlas' billing paradigm.
Key architectural decision: Integrating AI Model cost into Atlas billing experience
Rather than introducing a separate cost view for AI Models, I integrated AI Model cost into Atlas' existing billing experience. This works better for Atlas because:
- •
Different freshness expectations: AI Model usage updates hourly, while Atlas billing updates daily. Keeping these views separate avoids confusion about data freshness and prevents users from assuming real-time cost accuracy.
- •
A single source of truth for cost: Atlas customers expect all costs—clusters, data transfer, and AI Models—to live in one billing system, not scattered across service-specific pages.
- •
Clear conceptual boundaries: Usage focuses on consumption and quotas. Billing focuses on financial reconciliation. Each surface answers a different user question.
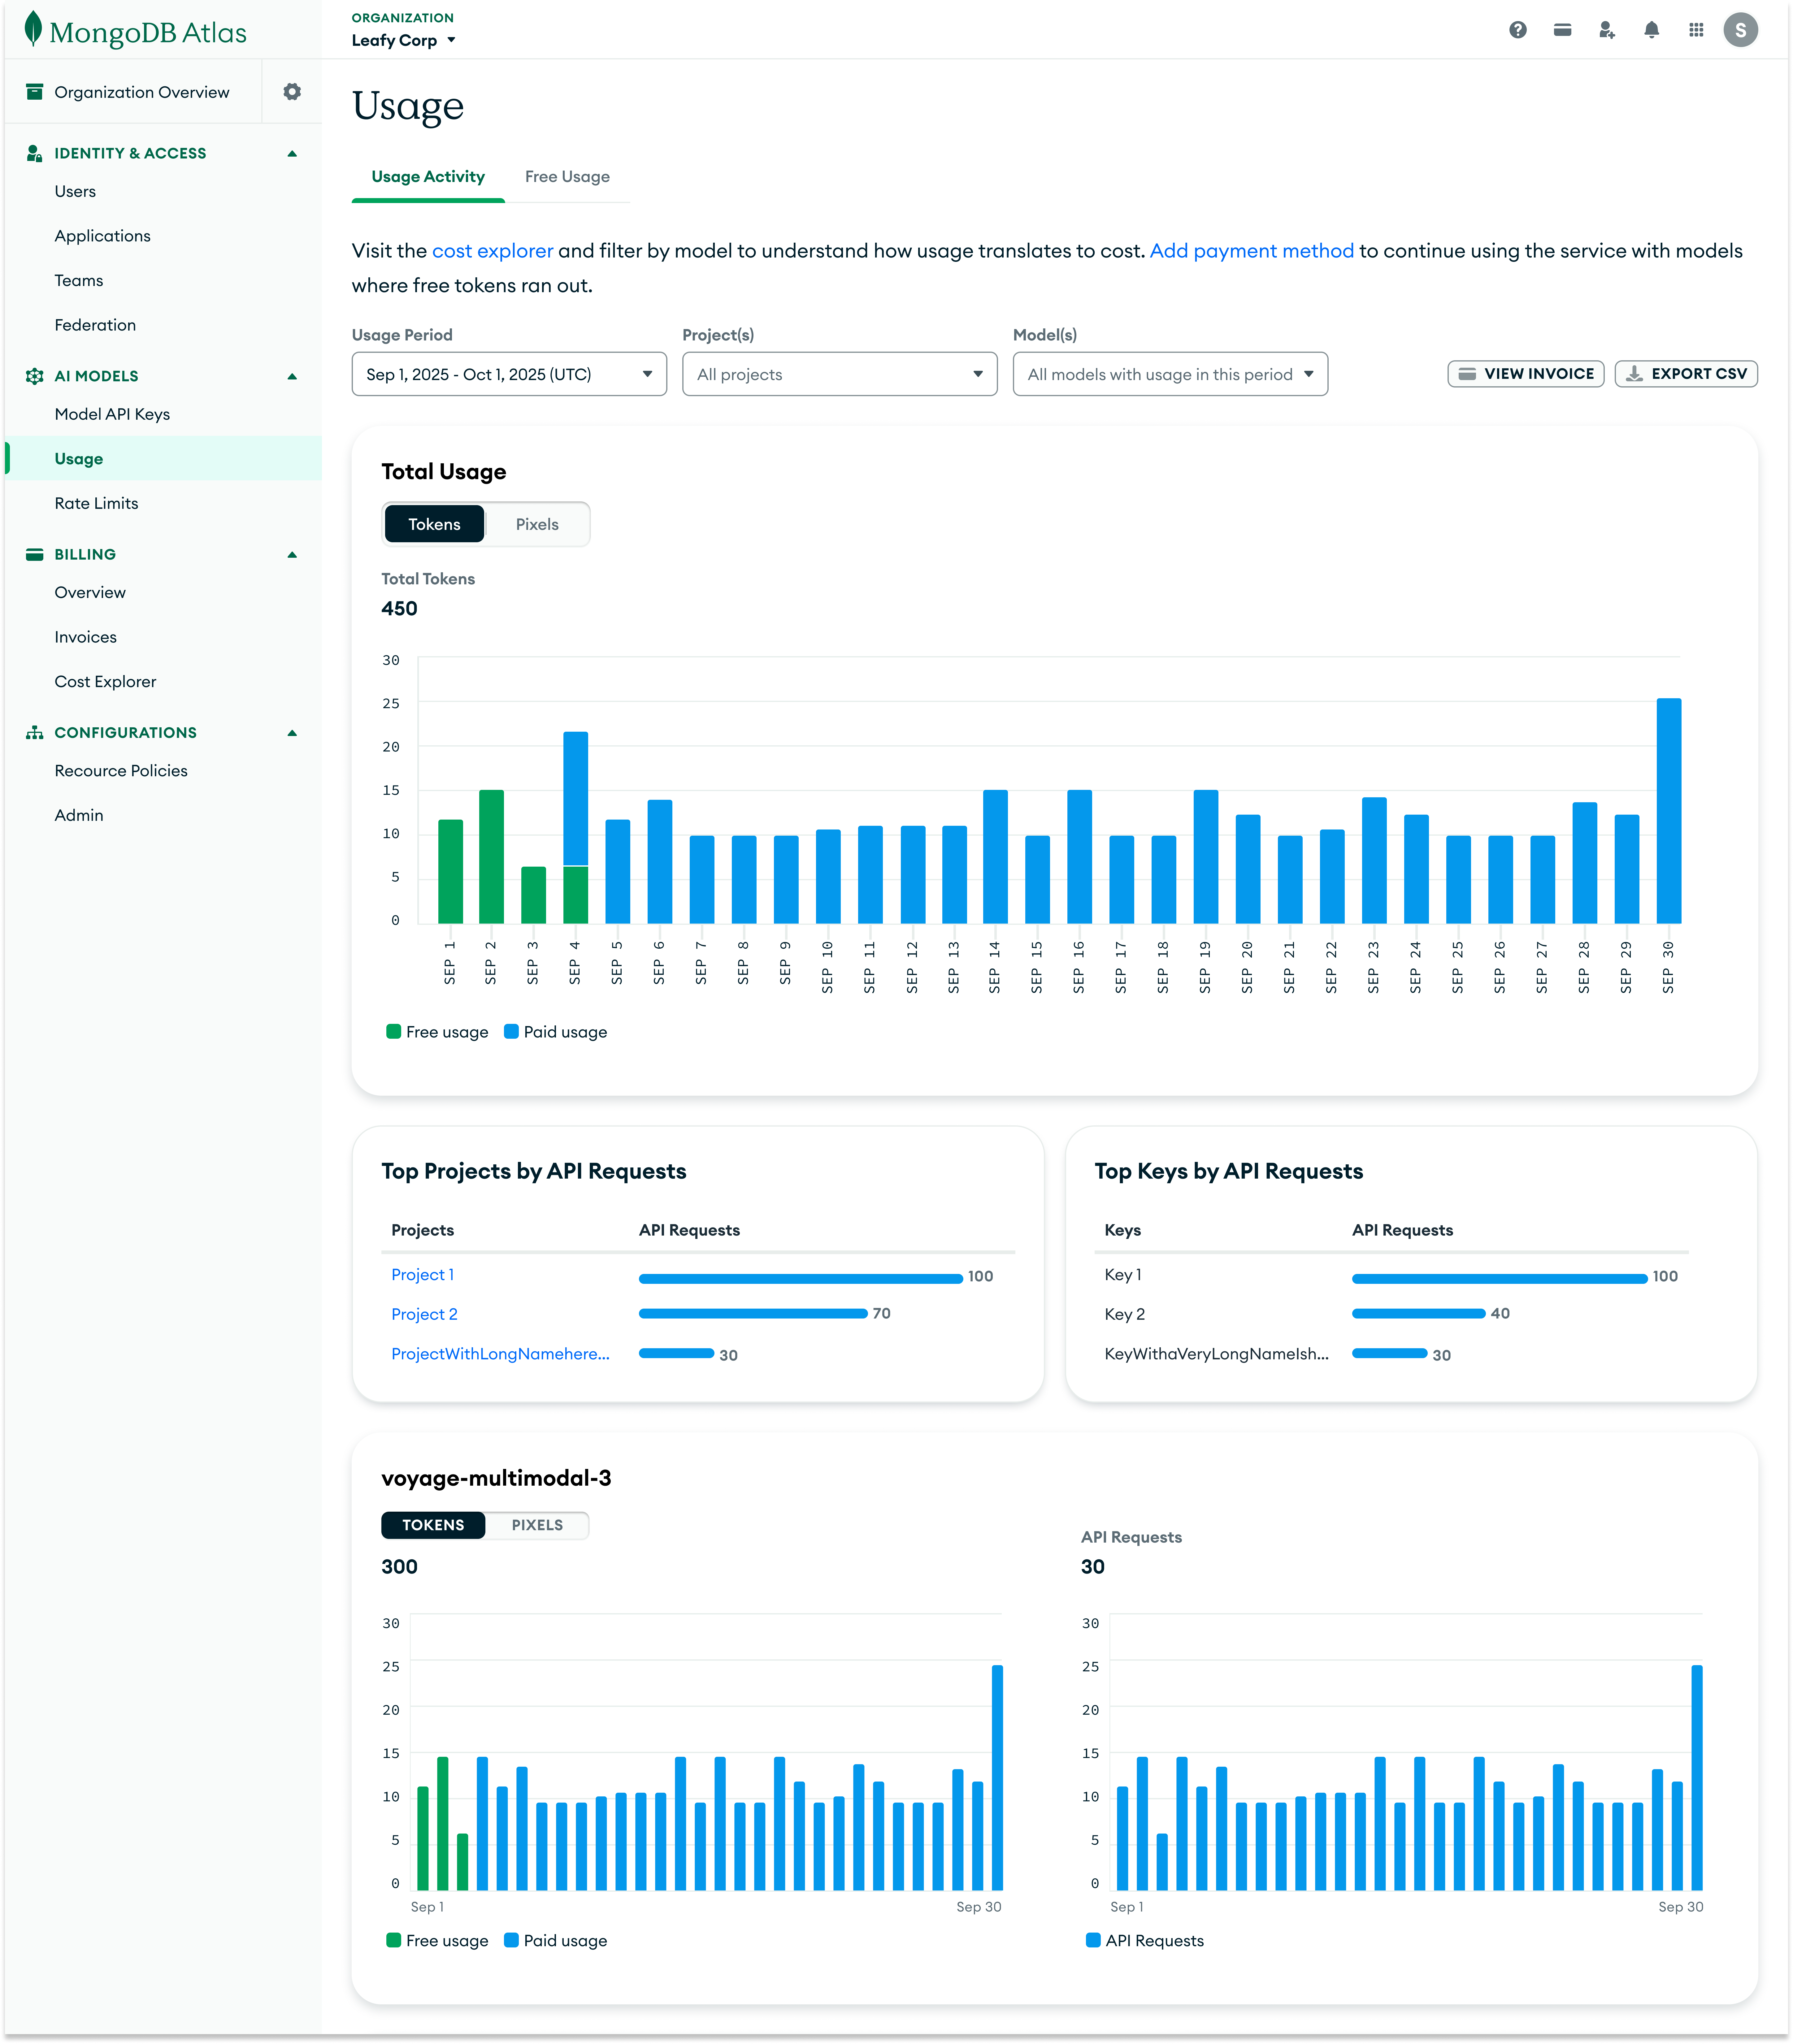
Total Usage: Daily visibility with smart filtering
I designed the Total Usage chart as the primary surface for understanding model consumption for both organization and project level usage pages. The time-series visualization shows daily token or pixel usage, with free usage visually separated from paid usage using distinct colors.
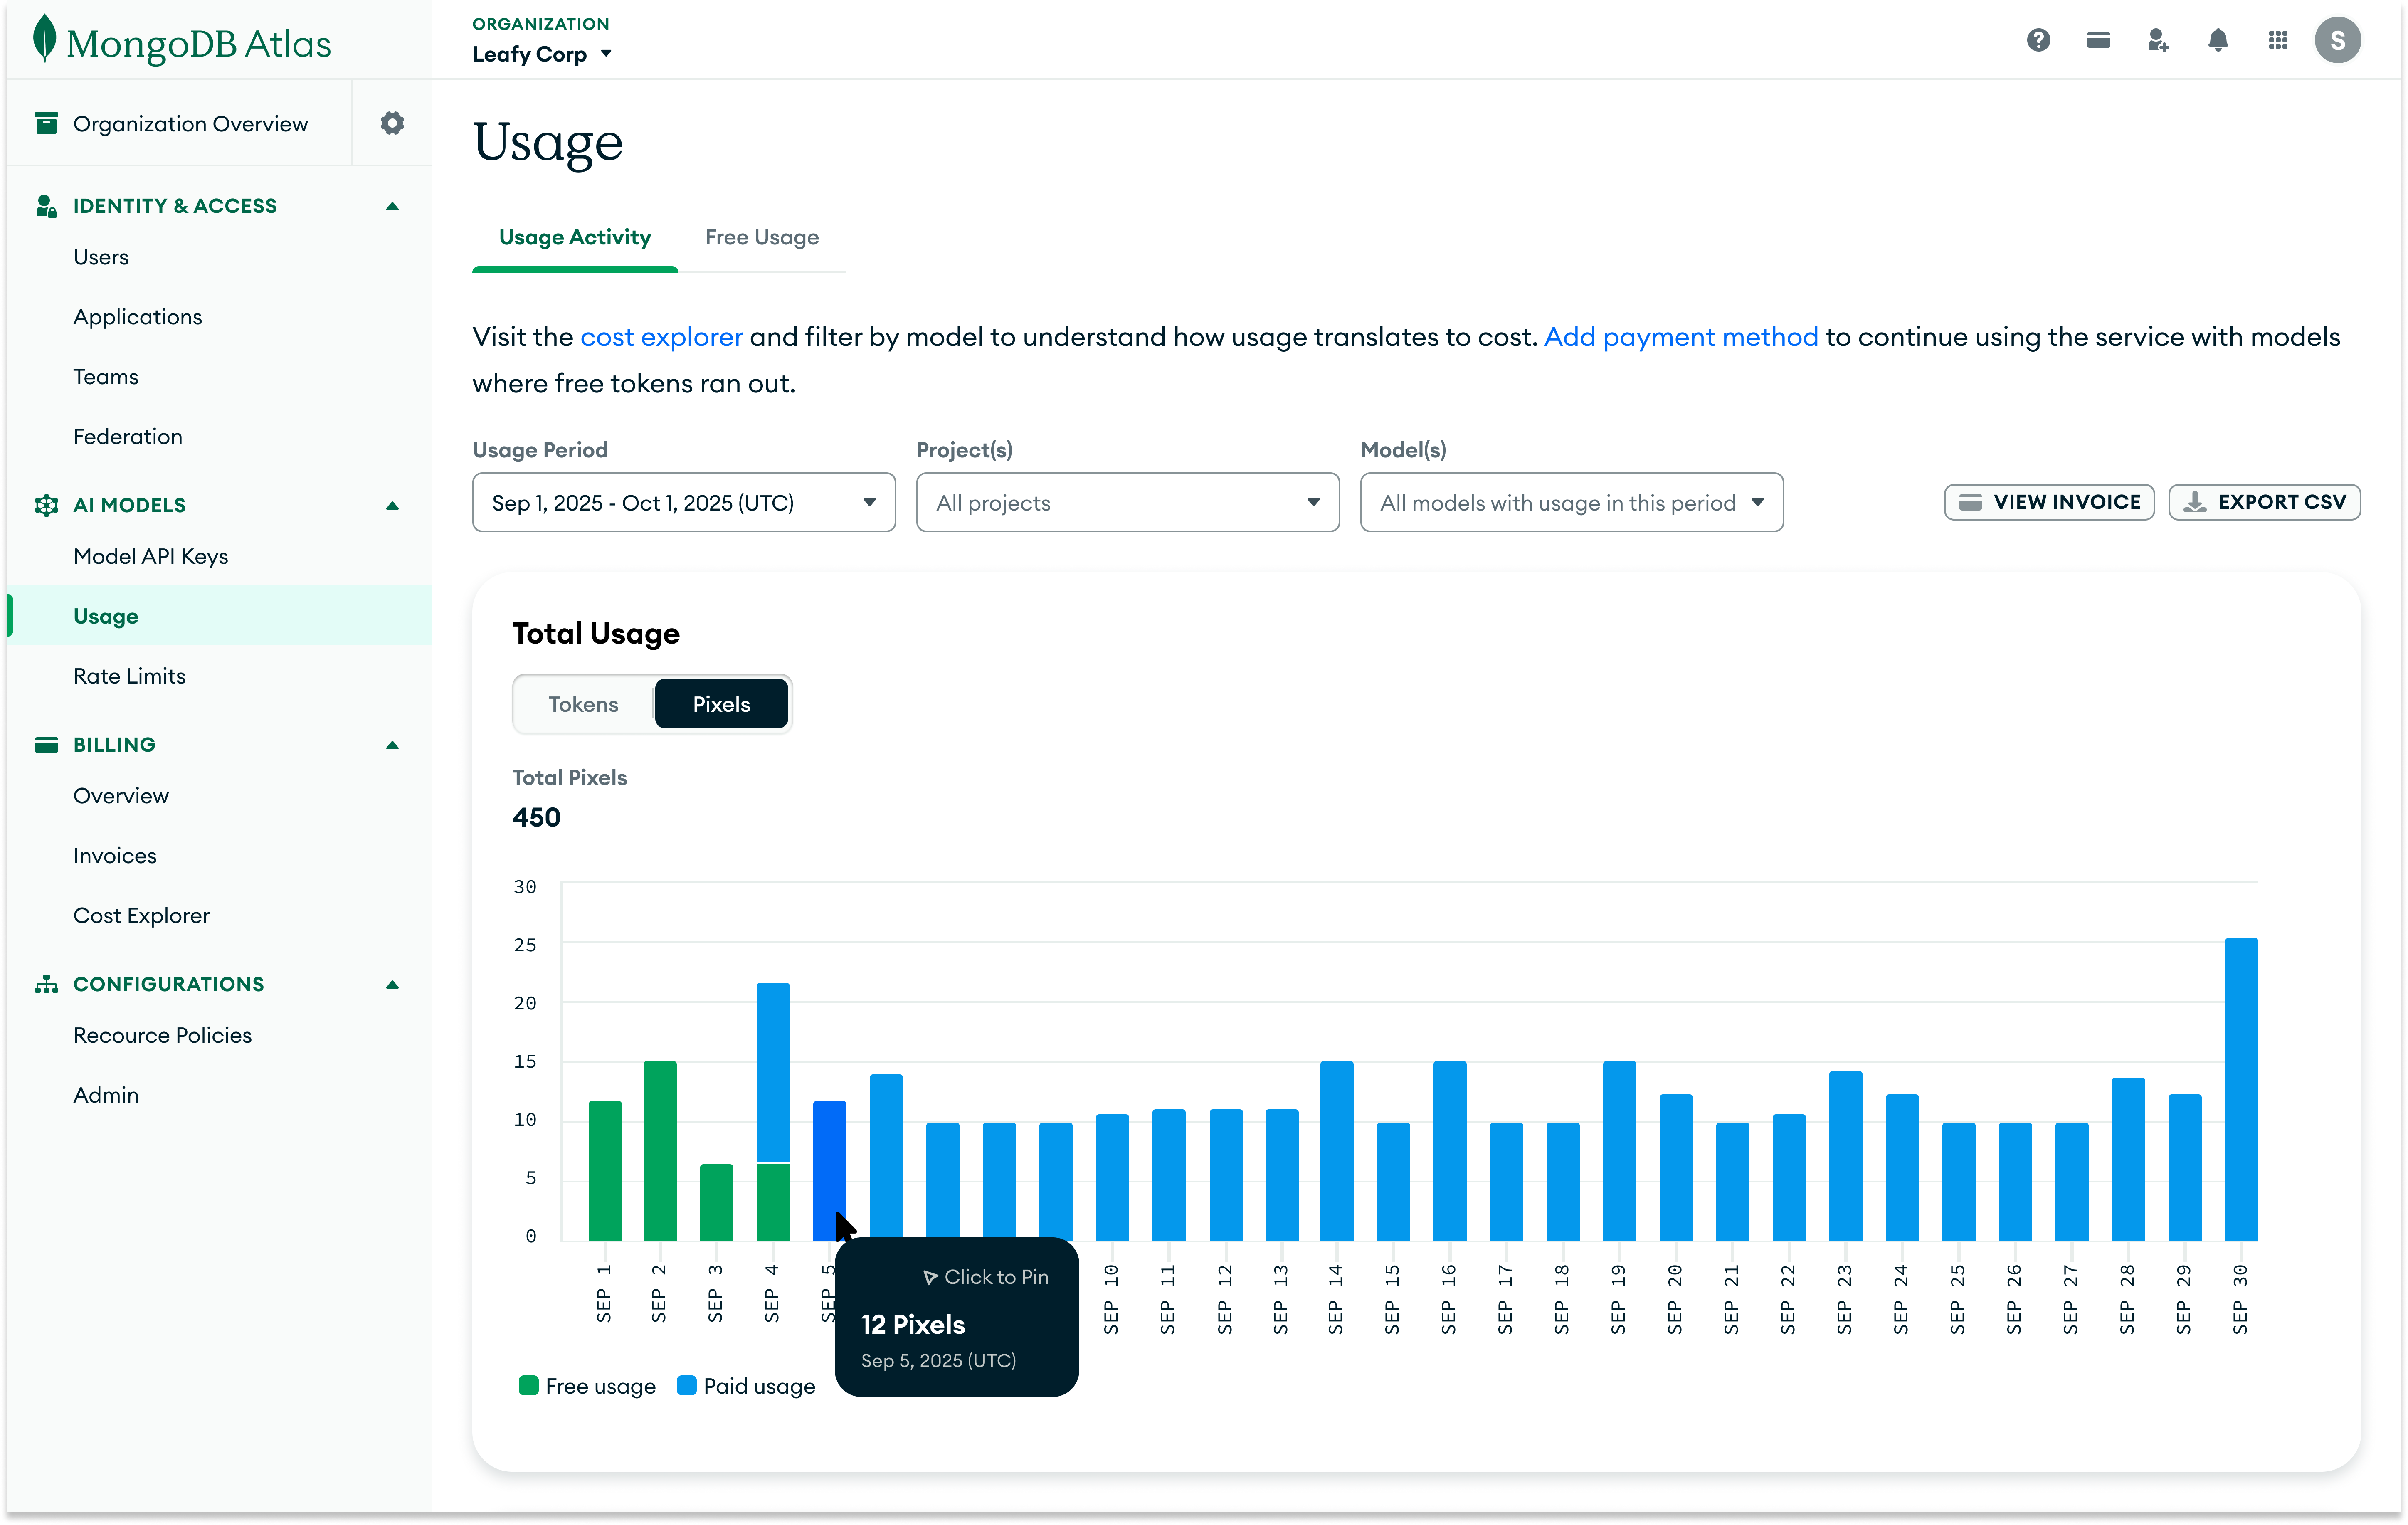
Users can navigate between token and pixel usage, and filter by:
- •
Time period: Monthly usage windows that correspond to invoice months.
- •
Projects: Org-level users can scope to specific projects. This filter is only available on the organization-level usage activity page.
- •
Models: Choose specific models to aggregate the usage by.
Top projects and keys by API requests: Identifying traffic and likely consumption drivers
Below the main tokens/pixels chart, I added ranked lists showing which API keys and projects are generating the most API requests.
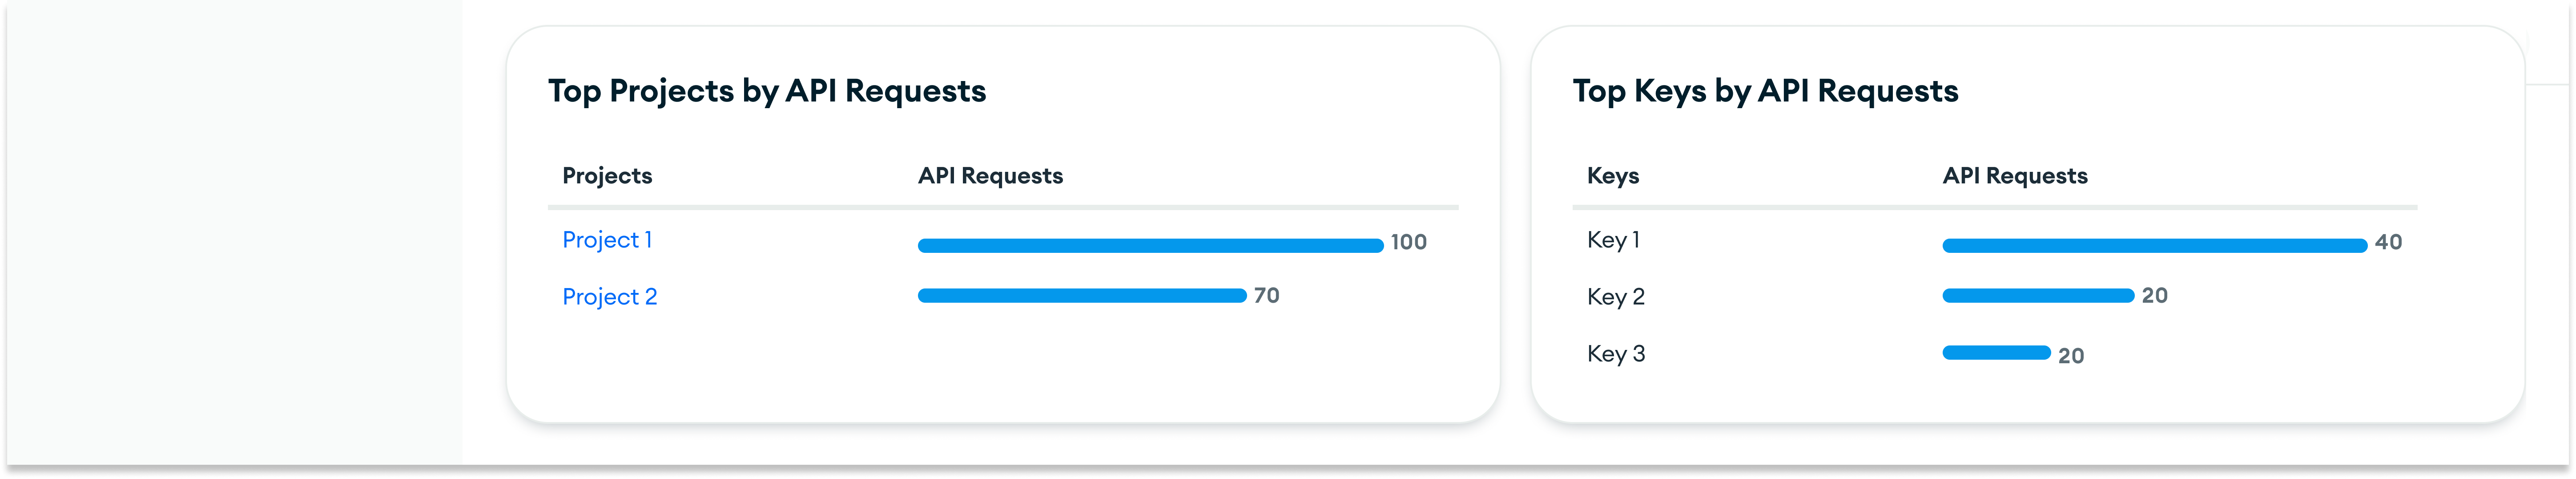
While requests are not the billing unit, they provide a strong signal of where usage is coming from. This helps users quickly identify:
- •Which API keys are generating unexpected traffic.
- •Which projects across the organization are responsible for the largest share of requests.
- •Where to investigate first when token or pixel usage spikes in the main chart.
Together with the primary usage chart, this breakdown turns aggregate activity into actionable starting points for debugging and cost analysis, without requiring additional clicks or navigation.
Per-model breakdown: Detailed usage and API request visibility by model
Beyond aggregate usage, users also need to understand how individual models are performing. Below the total usage chart, I introduced model-specific cards that present side‑by‑side views of token and pixel consumption and API request counts for each model.
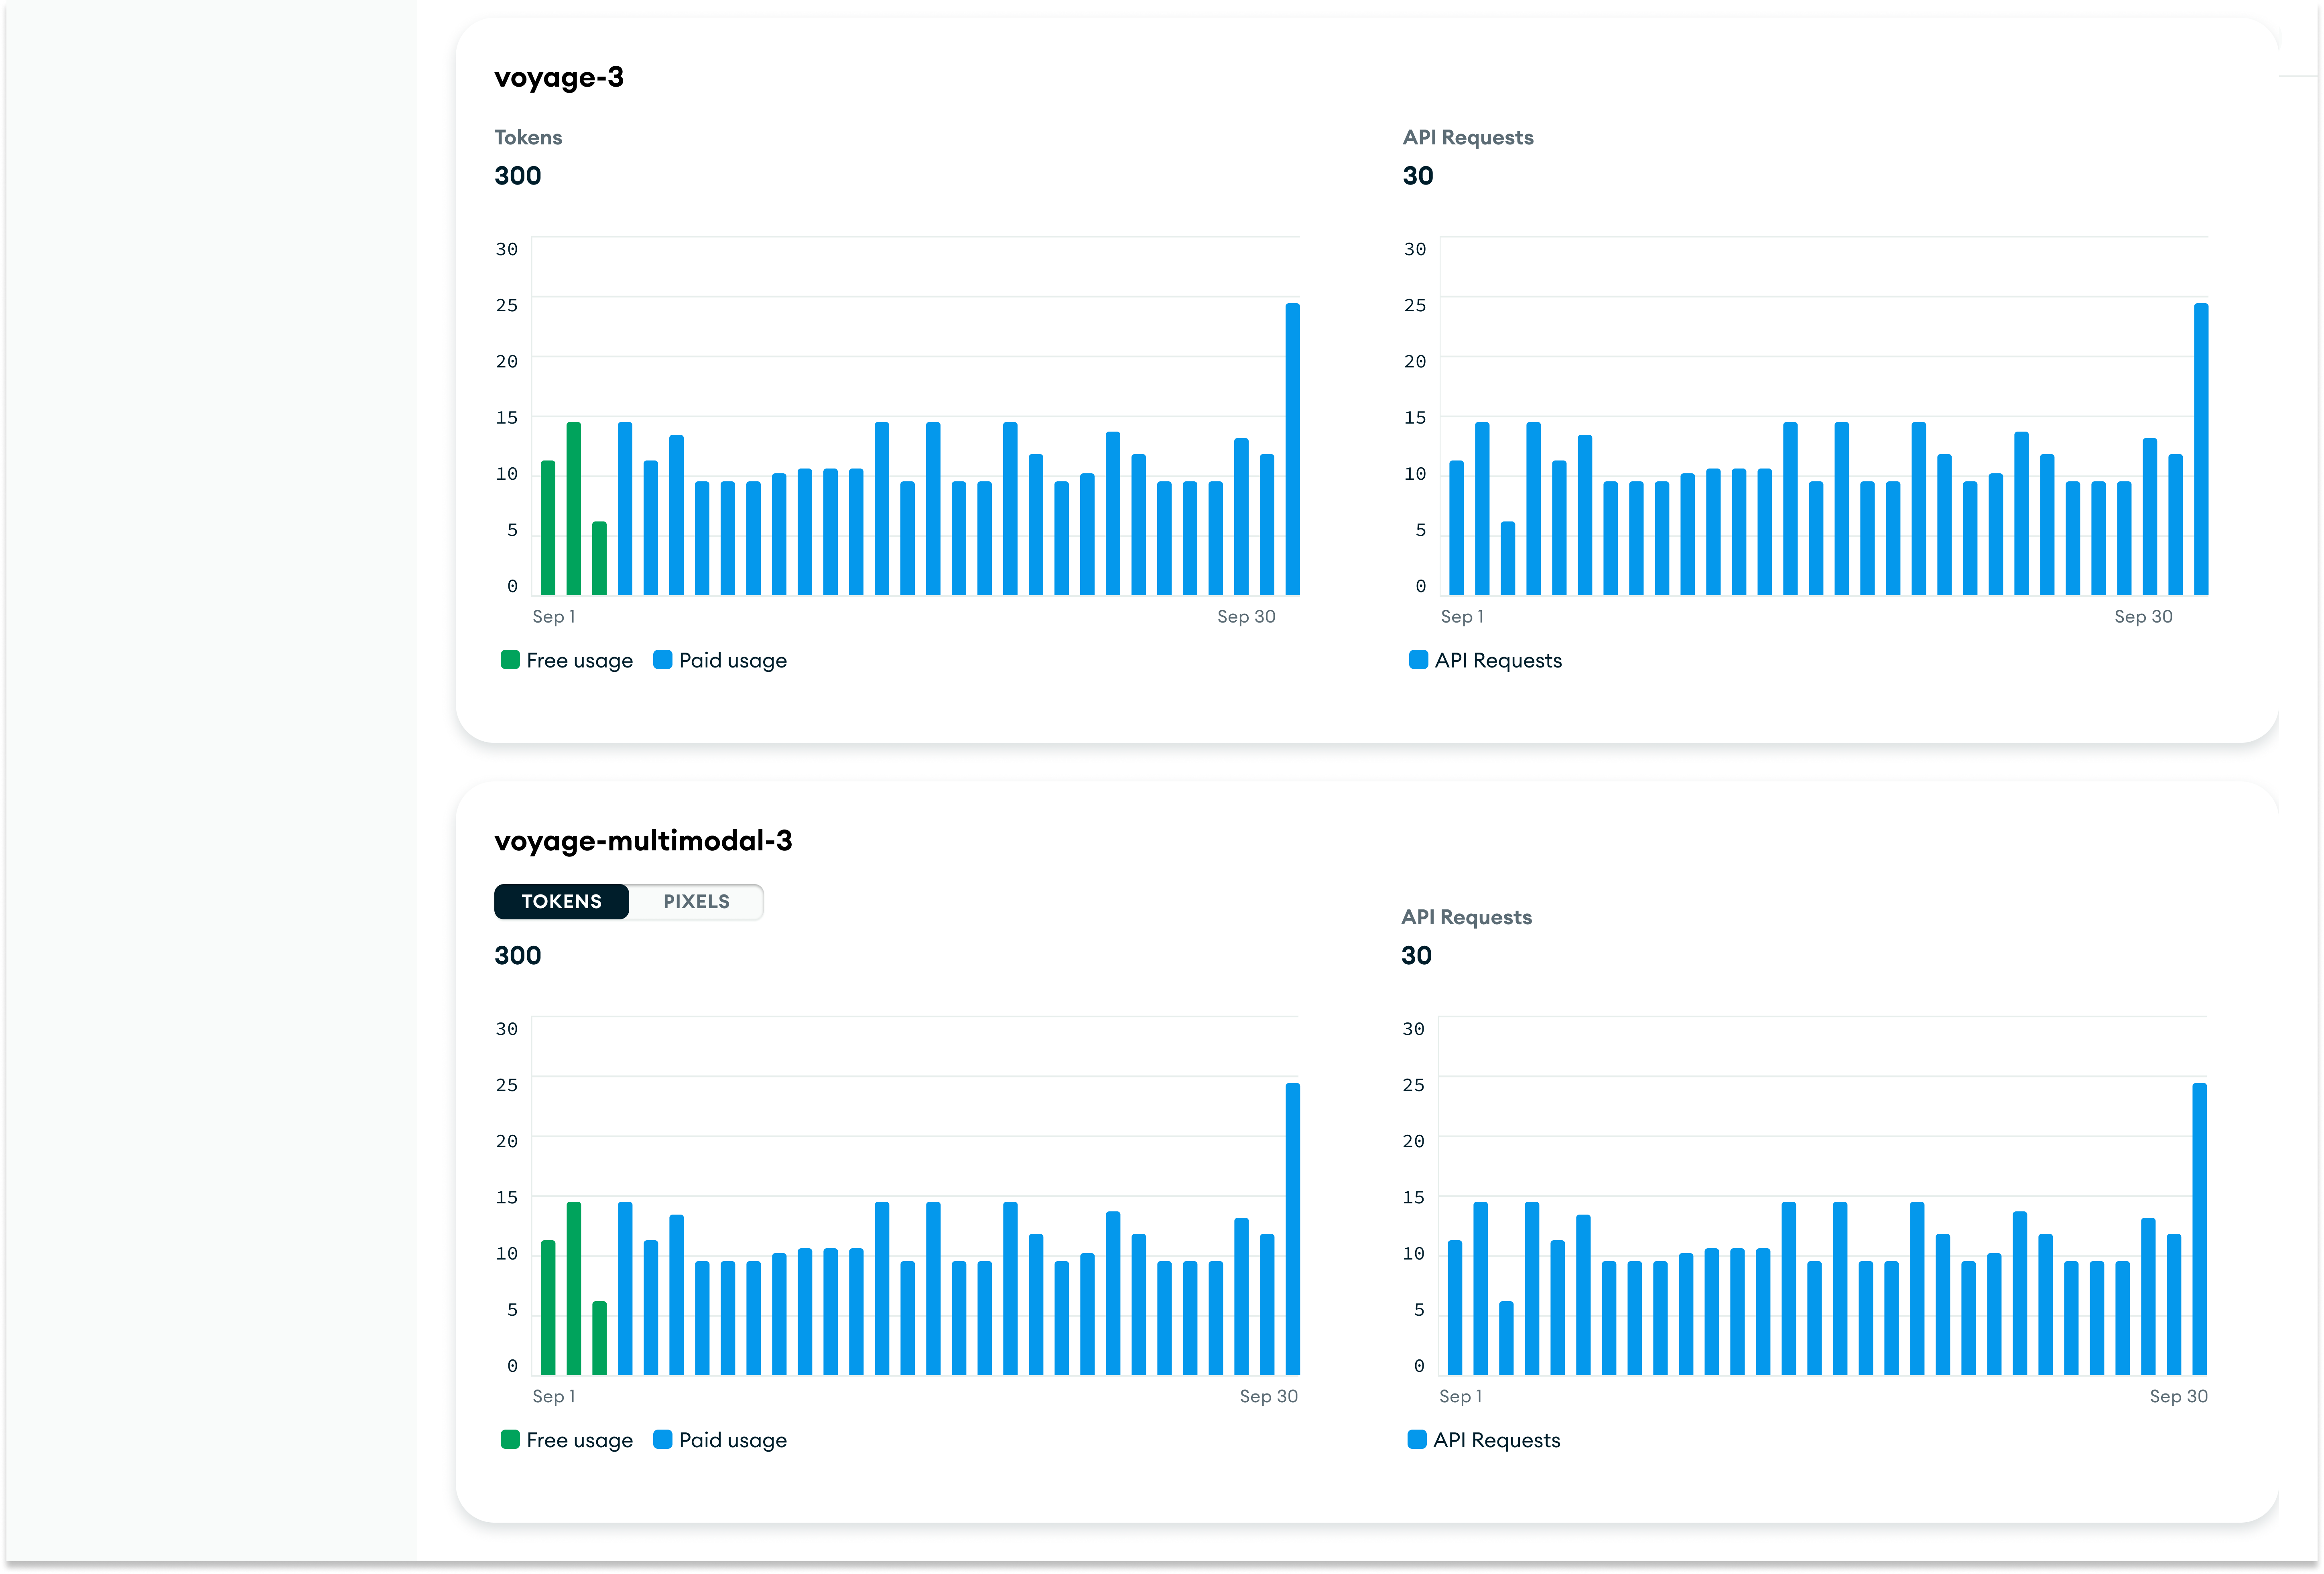
Each model card displays:
- •Side‑by‑side charts showing tokens or pixels consumed and the number of API requests made.
- •A clear visual distinction between free usage and paid usage through color‑coding.
- •Unit toggles for multimodal models that let users switch between viewing tokens and pixels.
This layout lets users quickly scan across models to see which ones are driving the most consumption (tokens/pixels) and the highest request volume, supporting both high‑level comparison and deeper investigation.
Free usage page: Making free usage quotas visible
I designed a dedicated Free Usage page that surfaces per‑model quota consumption at a glance.
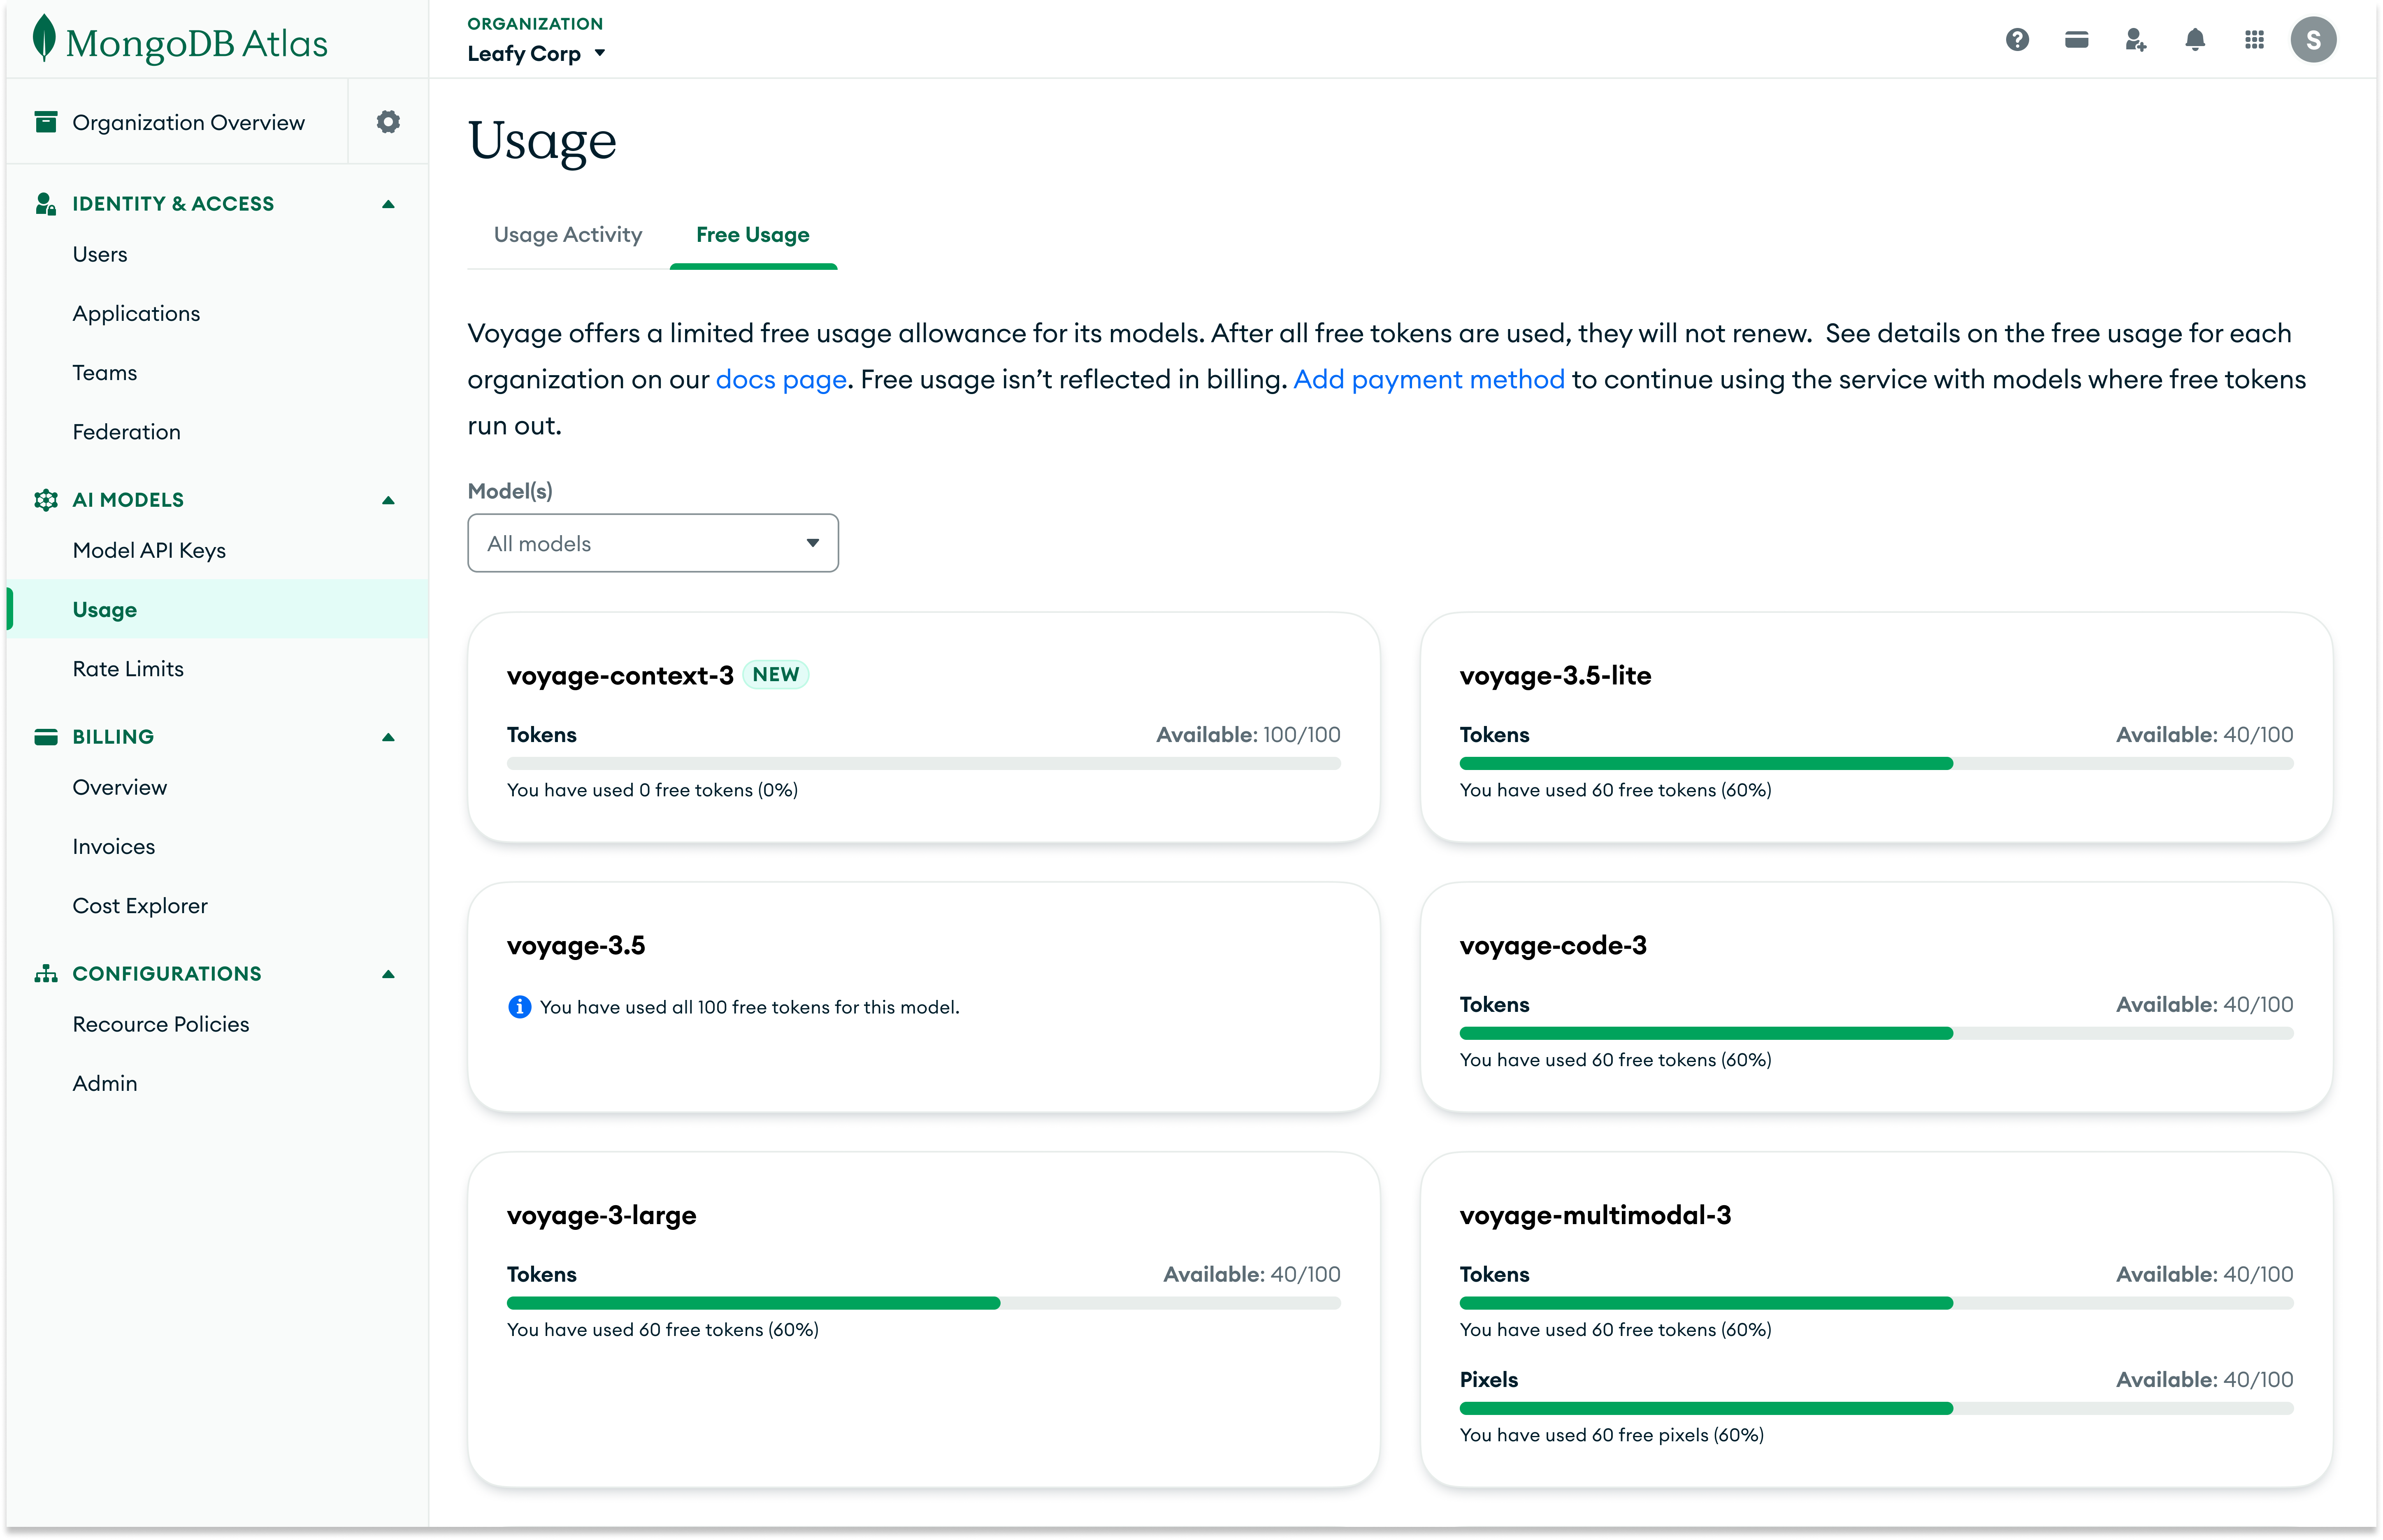
Each model card displays:
- •The total number of free tokens or pixels allocated to that model.
- •The amount of free quota that has already been consumed.
- •A visual progress bar that highlights how close the model is to exhausting its free quota and switching to paid usage.
By surfacing quota, consumption, and remaining free usage in one place, this design both encourages customers to experiment with new models while they still have free capacity and makes it easy to track how close they are to exhausting their free tokens and pixels.
Impact
Model‑level AI usage visibility
Introduced dedicated model‑level usage views for AI Models at both org and project level, so teams can see how individual Voyage models are being used without leaving Atlas.
Org‑wide monitoring in a single surface
Gave org admins one org‑level surface to monitor AI Models usage across all projects—with optional project filters—instead of visiting each project's page separately.
Clear separation of usage vs billing
Separated usage metrics from billing while still centralizing AI Models cost, by embedding Voyage's cost view in Atlas Billing and keeping tokens/pixels/requests and free quotas in the AI Models Usage experience.